Pridebay Asia UHNWI Lifestyle Index 2025
Author: Pridebay Asia
Report Date: 2025
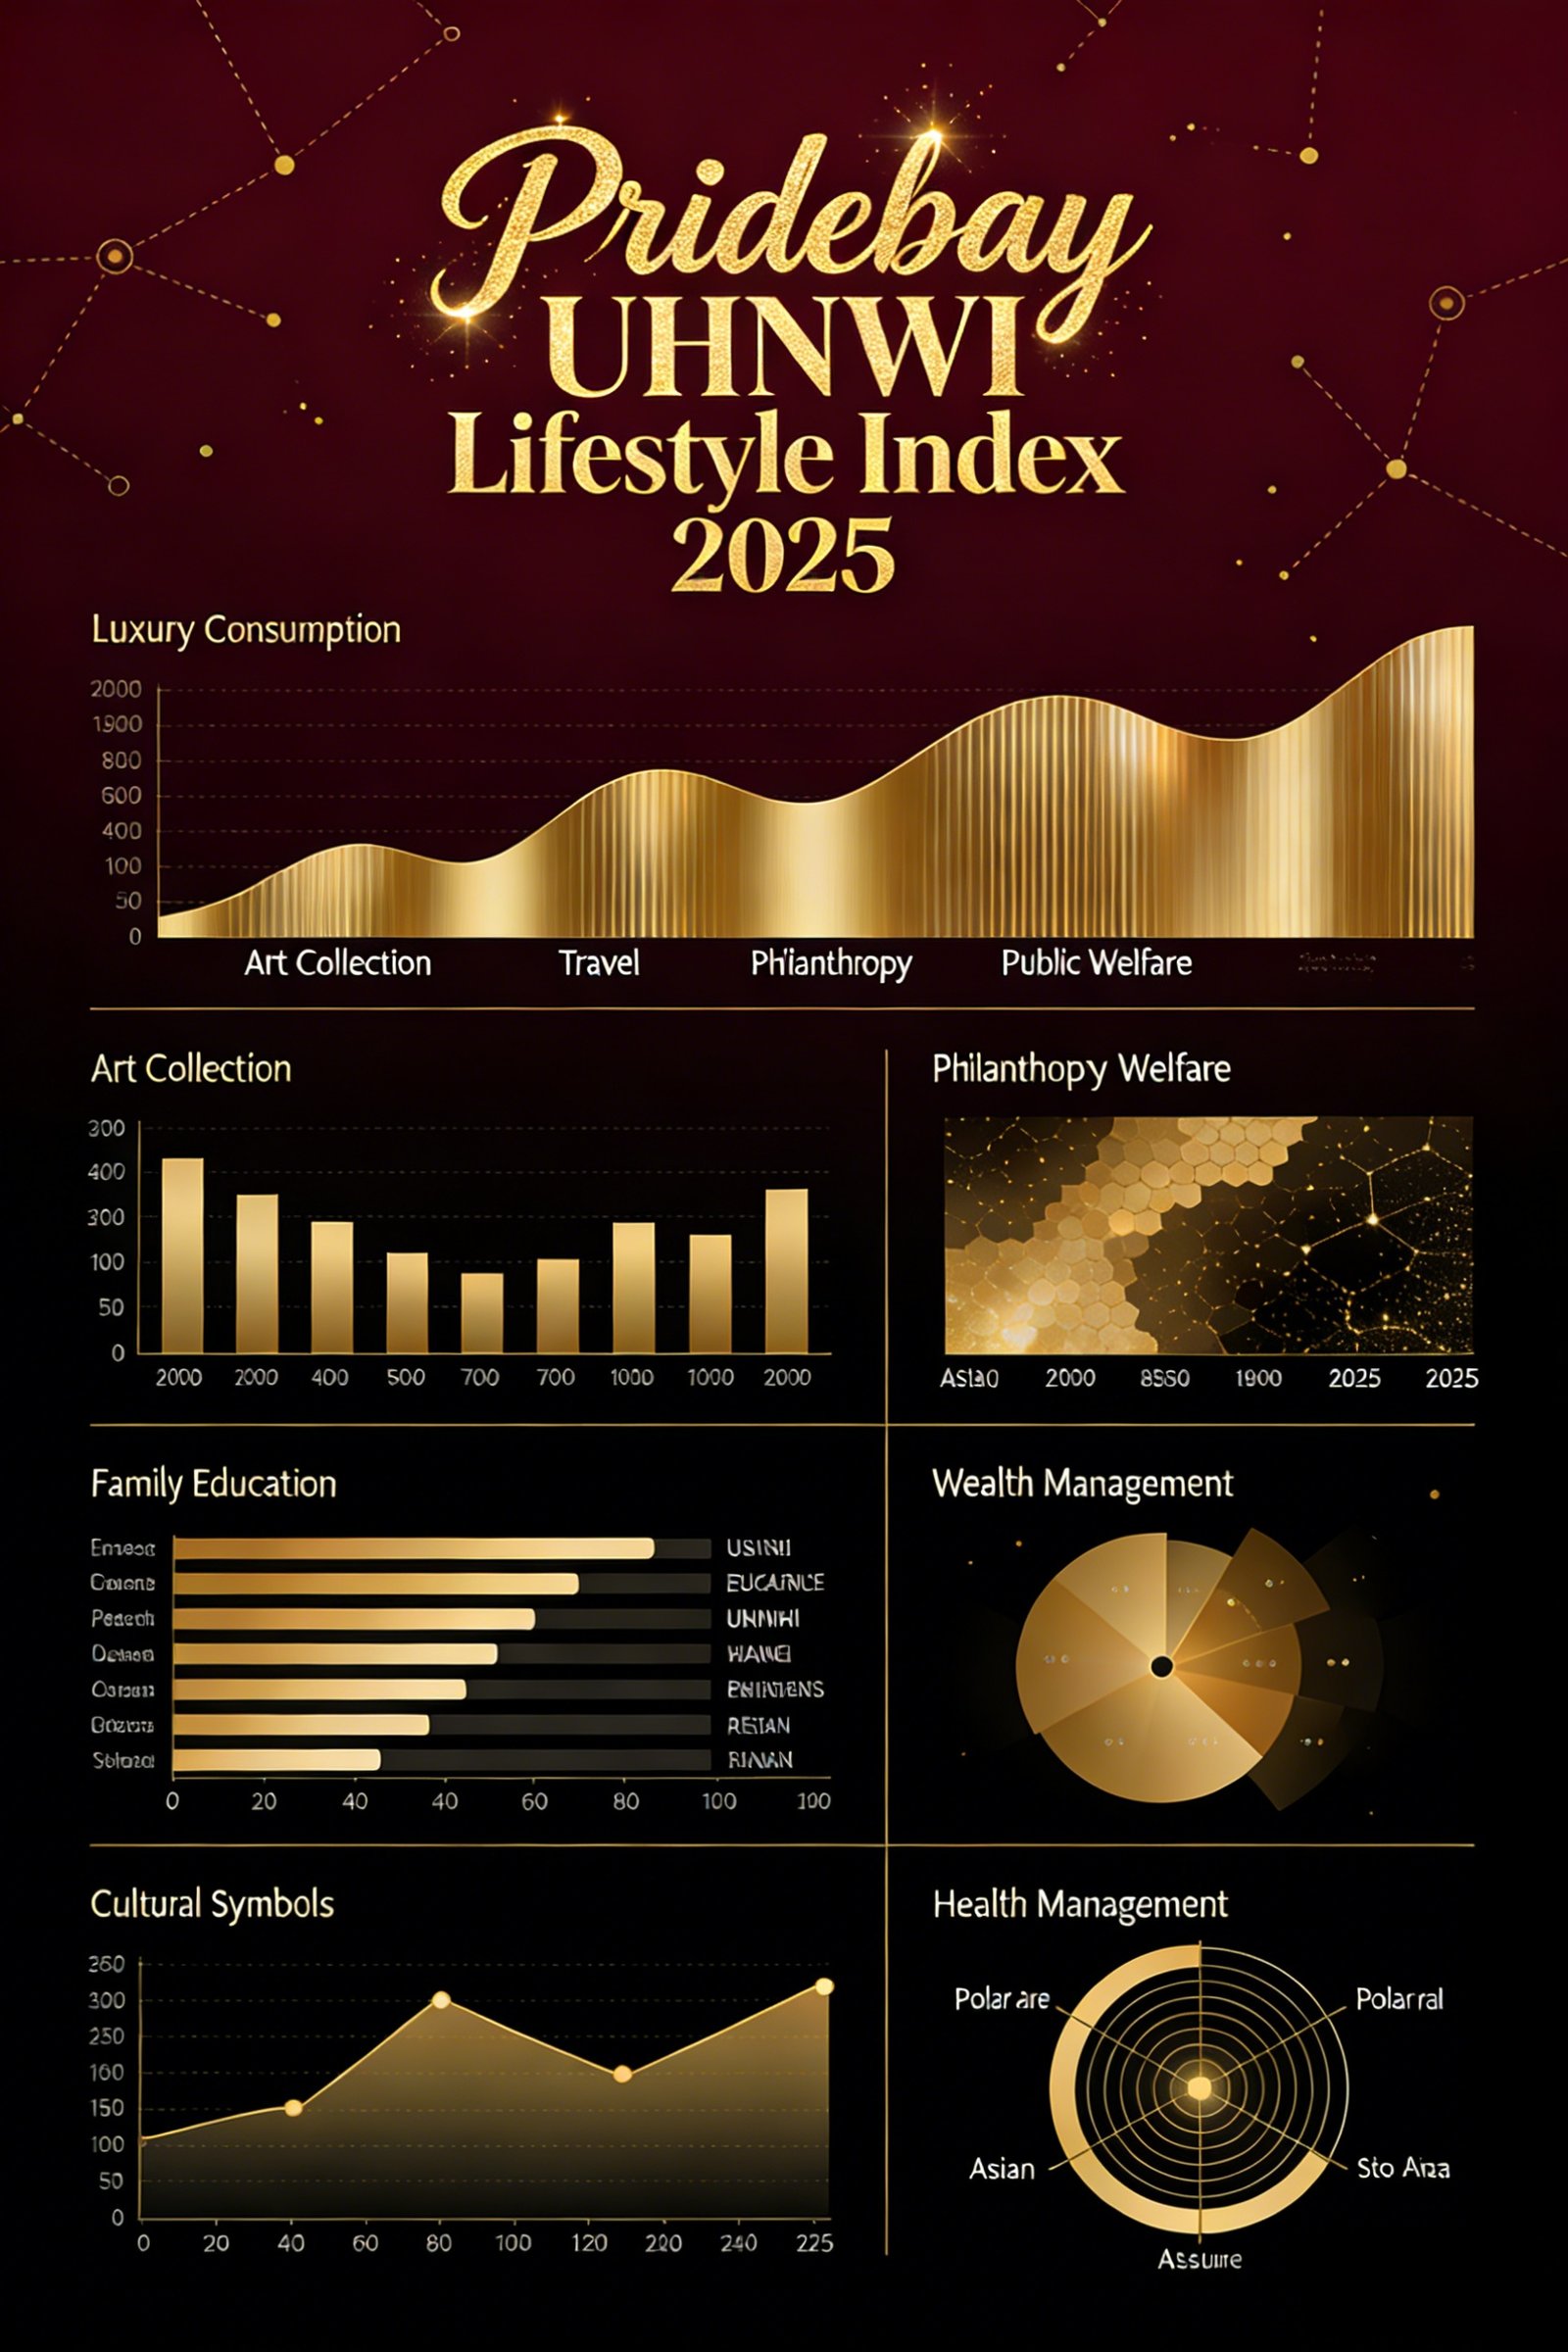
Abstract: The Pridebay Asia UHNWI Lifestyle Index 2025 is a comprehensive research benchmark that measures the lifestyle trends and behavioral preferences of Ultra-High-Net-Worth Individuals (UHNWIs, defined as individuals with investable assets exceeding USD 30 million) across Asia. This report is based on an exclusive survey conducted by Pridebay Asia covering 800+ UHNWIs from key Asian markets (China, Singapore, Indonesia, Thailand, Malaysia, India, and Vietnam), combined with authoritative industry data from luxury consumption trackers, art market institutions, and wealth management associations. The index evaluates eight core lifestyle dimensions—Luxury Consumption, Art Collection, Travel, Philanthropy & Public Welfare, Family Education, Wealth Management, Cultural Symbols, and Health Management—with each dimension scored on a 0-100 scale (100 representing the highest level of engagement, sophistication, and market influence). Key findings reveal that Health Management and Family Education have emerged as the top-performing indices in 2025, driven by UHNWIs’ increased focus on long-term well-being and intergenerational wealth inheritance. Meanwhile, Sustainable Luxury Consumption and Impact Philanthropy are becoming defining trends, reshaping the lifestyle landscape of Asian UHNWIs. This report provides strategic insights for luxury brands, art institutions, wealth management firms, and lifestyle service providers to better align with the evolving needs of Asia’s elite.
1. Executive Summary of the Index
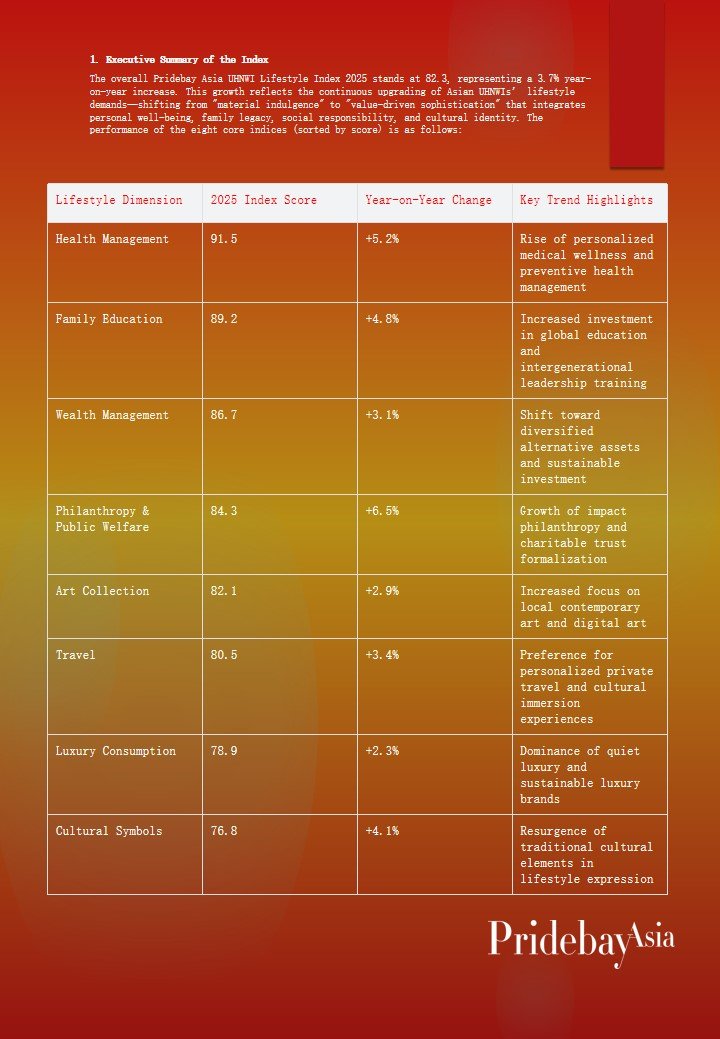
The overall Pridebay Asia UHNWI Lifestyle Index 2025 stands at 82.3, representing a 3.7% year-on-year increase. This growth reflects the continuous upgrading of Asian UHNWIs’ lifestyle demands—shifting from "material indulgence" to "value-driven sophistication" that integrates personal well-being, family legacy, social responsibility, and cultural identity. The performance of the eight core indices (sorted by score) is as follows:
|
Lifestyle Dimension |
2025 Index Score |
Year-on-Year Change |
Key Trend Highlights |
|---|---|---|---|
|
Health Management |
91.5 |
+5.2% |
Rise of personalized medical wellness and preventive health management |
|
Family Education |
89.2 |
+4.8% |
Increased investment in global education and intergenerational leadership training |
|
Wealth Management |
86.7 |
+3.1% |
Shift toward diversified alternative assets and sustainable investment |
|
Philanthropy & Public Welfare |
84.3 |
+6.5% |
Growth of impact philanthropy and charitable trust formalization |
|
Art Collection |
82.1 |
+2.9% |
Increased focus on local contemporary art and digital art |
|
Travel |
80.5 |
+3.4% |
Preference for personalized private travel and cultural immersion experiences |
|
Luxury Consumption |
78.9 |
+2.3% |
Dominance of quiet luxury and sustainable luxury brands |
|
Cultural Symbols |
76.8 |
+4.1% |
Resurgence of traditional cultural elements in lifestyle expression |
2. Detailed Analysis of Core Lifestyle Indices
2.1 Health Management (Index: 91.5, +5.2% YoY)
The Health Management index ranks highest in 2025, highlighting Asian UHNWIs’ prioritization of long-term health and well-being. Key drivers include: 1) Rising demand for personalized preventive health solutions—83% of surveyed UHNWIs have purchased annual private health assessments, with an average spending of USD 25,000, and 67% have subscribed to personalized nutrition and fitness plans. 2) Growth of medical wellness tourism—Switzerland, Japan, and Singapore are the top destinations for anti-aging treatments and regenerative therapy, with average spending per trip exceeding USD 100,000. 3) Integration of technology in health management—62% of UHNWIs use wearable health monitoring devices, and 45% have adopted AI-powered health risk prediction tools. The index growth is also fueled by the increasing focus on mental health, with 58% of surveyed UHNWIs investing in mindfulness training and psychological counseling services.
2.2 Family Education (Index: 89.2, +4.8% YoY)
The Family Education index reflects Asian UHNWIs’ commitment to intergenerational wealth and talent inheritance. Key trends include: 1) Global education diversification—76% of UHNWIs plan to send their children to international schools or universities abroad, with a focus on institutions that combine academic excellence with leadership training. The average annual education spending per child reaches USD 180,000. 2) Intergenerational leadership programs—53% of family offices have launched customized training programs for the next generation, covering business management, financial literacy, and social responsibility. 3) Cultural education emphasis—49% of UHNWIs invest in traditional cultural education (e.g., Chinese calligraphy, Japanese tea ceremony) for their children to strengthen cultural identity. The year-on-year growth of the index is driven by the increasing recognition that "talent inheritance is as important as asset inheritance."
2.3 Wealth Management (Index: 86.7, +3.1% YoY)
The Wealth Management index reflects the sophistication and diversification of Asian UHNWIs’ asset allocation strategies. Key developments: 1) Expansion of alternative assets—UHNWIs allocate an average of 35% of their portfolios to alternative assets, including private equity, venture capital, art, and luxury real estate. Sustainable investment (ESG) accounts for 22% of these allocations, a 7% increase from 2024. 2) Formalization of family office services—81% of UHNWIs with assets exceeding USD 1 billion have established family offices, focusing on tax planning, asset protection, and intergenerational inheritance. 3) Cross-border asset allocation optimization—driven by global economic volatility, 65% of UHNWIs have adjusted their cross-border asset portfolios to enhance risk resistance. The index growth is supported by the maturing of Asia’s wealth management industry and UHNWIs’ increasing demand for professional, integrated services.
2.4 Philanthropy & Public Welfare (Index: 84.3, +6.5% YoY)
The Philanthropy & Public Welfare index shows the fastest growth among all dimensions, indicating a shift from "passive donation" to "strategic philanthropy" among Asian UHNWIs. Key trends: 1) Rise of impact philanthropy—72% of donations are targeted at specific causes (education, healthcare, climate action) with measurable social impact, rather than general charitable giving. 2) Formalization of charitable structures—46% of UHNWIs have established charitable trusts or foundations to ensure long-term, systematic philanthropy, supported by favorable tax policies in markets like Singapore and Hong Kong. 3) Collaborative philanthropy—38% of UHNWIs participate in philanthropic collaboratives to pool resources and address complex social issues. The index growth is also driven by the increasing recognition of philanthropy as a core part of family legacy and social responsibility.
2.5 Art Collection (Index: 82.1, +2.9% YoY)
The Art Collection index reflects the evolving taste and investment logic of Asian UHNWIs in art. Key trends: 1) Local contemporary art focus—57% of UHNWIs plan to increase their collections of local Asian artists, driven by growing cultural identity and potential appreciation value. 2) Digital art integration—42% of young UHNWIs (under 40) have collected digital art or NFTs, viewing them as both artistic expressions and alternative assets. 3) Art as family legacy—61% of UHNWIs include art collections in their family inheritance plans, with professional art appraisal and restoration services in high demand. The moderate growth of the index is attributed to the cautious attitude toward high-priced international masterpieces amid global economic uncertainty, with UHNWIs favoring mid-to-high-end works with clear cultural and investment value.
2.6 Travel (Index: 80.5, +3.4% YoY)
The Travel index reflects the recovery and upgrading of Asian UHNWIs’ travel demands. Key trends: 1) Private and personalized travel—85% of UHNWIs prefer customized private travel itineraries, with a focus on exclusivity and privacy. Popular experiences include private yacht cruises, helicopter tours, and exclusive cultural visits (e.g., private viewings of heritage sites). 2) Wellness and cultural immersion—68% of travel plans include wellness elements (e.g., spa retreats, yoga resorts) or cultural experiences (e.g., local artisan workshops, traditional festivals). 3) Sustainable travel—53% of UHNWIs prioritize eco-friendly accommodations and transportation options, such as carbon-neutral resorts and electric private jets. The index growth is supported by the full recovery of international travel and UHNWIs’ willingness to spend on high-quality, meaningful travel experiences.
2.7 Luxury Consumption (Index: 78.9, +2.3% YoY)
The Luxury Consumption index reflects the shift toward rationality and value orientation in Asian UHNWIs’ luxury spending. Key trends: 1) Quiet luxury dominance—76% of UHNWIs prefer understated, high-quality luxury brands (e.g., Loro Piana, Brunello Cucinelli) over logo-heavy designs, emphasizing craftsmanship and brand values. 2) Sustainable luxury—64% of UHNWIs consider a brand’s sustainability practices when making purchases, driving luxury brands to launch eco-friendly collections and transparent supply chains. 3) Customization and exclusivity—59% of UHNWIs have purchased customized luxury products (e.g., tailored clothing, personalized jewelry) to reflect their unique tastes. The moderate index growth is due to the shift from "quantity consumption" to "quality consumption," with UHNWIs spending more selectively on products and experiences that align with their values.
2.8 Cultural Symbols (Index: 76.8, +4.1% YoY)
The Cultural Symbols index measures the integration of traditional and cultural elements into Asian UHNWIs’ lifestyles. Key trends: 1) Traditional cultural revival—63% of UHNWIs incorporate traditional cultural elements into their daily lives, such as collecting traditional crafts, wearing traditional-inspired clothing, and hosting cultural-themed events. 2) Cultural travel and experiences—54% of UHNWIs participate in cultural heritage tours or traditional art workshops to deepen their understanding of local and global cultures. 3) Brand collaboration with cultural heritage—47% of UHNWIs are willing to purchase luxury products that collaborate with cultural heritage institutions (e.g., luxury brands partnering with museums for limited-edition collections). The index growth reflects Asian UHNWIs’ increasing cultural confidence and desire to express their identity through cultural symbols.
3. Regional Differences in UHNWI Lifestyle Indices
There are notable regional differences in the performance of the Pridebay Asia UHNWI Lifestyle Index across key Asian markets, driven by cultural, economic, and policy factors:
China: Leading in Family Education (92.3) and Cultural Symbols (81.5), with strong emphasis on traditional cultural inheritance and intergenerational education. The Philanthropy & Public Welfare index (85.7) is also growing rapidly, driven by policy incentives and increased social responsibility awareness.
Singapore: Topping in Wealth Management (90.1) and Philanthropy & Public Welfare (88.6), leveraging its status as a global financial hub and favorable policies for charitable trusts. The Health Management index (93.2) is also the highest in Asia, supported by world-class medical facilities.
Southeast Asia (Indonesia, Thailand, Malaysia): Strong performance in Art Collection (83.4) and Travel (82.7), with a focus on local contemporary art and cultural travel. The Cultural Symbols index (79.2) reflects the region’s diverse cultural heritage.
India: Growing rapidly in Luxury Consumption (80.3) and Travel (81.1), with UHNWIs favoring high-end luxury brands and private travel experiences. The Family Education index (87.8) is also on the rise, driven by investment in global education.
4. Research Methodology
4.1 Data Collection
This report is based on two main data sources: 1) Exclusive survey: Conducted by Pridebay Asia from January to March 2025, covering 800+ UHNWIs across 7 key Asian markets. The survey included questions on lifestyle spending, preferences, and motivations. 2) Secondary data: Collected from authoritative industry reports (e.g., Bain & Company Luxury Report, Art Basel UBS Global Art Market Report), government statistics, and data from luxury brands, art institutions, and wealth management firms.
4.2 Index Calculation
The Pridebay Asia UHNWI Lifestyle Index is calculated using a weighted scoring model. Each of the 8 core dimensions is assigned a weight based on its importance to UHNWIs’ lifestyle (derived from survey data). The scoring criteria include: 1) Engagement level (e.g., frequency of participation, spending ratio); 2) Sophistication (e.g., preference for high-quality, personalized experiences); 3) Market influence (e.g., impact on industry trends, demand for related services). The index is normalized to a 0-100 scale for easy comparison.
5. Conclusion and Future Outlook
The Pridebay Asia UHNWI Lifestyle Index 2025 reveals that Asian UHNWIs’ lifestyles are entering a "value-driven" era, with Health Management, Family Education, and Philanthropy emerging as core priorities. The key trends shaping the future include: 1) Further integration of technology and lifestyle (e.g., AI in health management, digital art in collections); 2) Strengthened focus on sustainability and social responsibility (e.g., sustainable luxury, impact philanthropy); 3) Deepened cultural identity (e.g., traditional cultural elements in lifestyle expression); 4) Personalization and exclusivity (e.g., customized travel, private health services).
Looking ahead to 2026, the overall Pridebay Asia UHNWI Lifestyle Index is expected to grow by 3-4%, with Philanthropy & Public Welfare and Cultural Symbols likely to be the fastest-growing dimensions. As Asian UHNWIs continue to pursue a more sophisticated, meaningful, and responsible lifestyle, there will be increasing opportunities for brands and institutions that can align with these evolving demands.
Disclaimer: The information and data in this report are obtained from publicly available sources and Pridebay Asia’s exclusive research. While we strive to ensure the accuracy and completeness of the information, we do not assume any liability for errors or omissions. This report is for reference only and does not constitute any investment advice or business decision basis.